
How Car ECU Data Is Stored and Structured for ECU Dump Analysis 2
How Car ECU Data Is Stored and Structured for ECU Dump Analysis
Modern automotive ECUs store much more than just program code. A typical dump may contain executable firmware, calibration maps, identifiers, checksums, adaptation data, diagnostic records, coding information, and other non-volatile runtime data. For anyone building an ECU dump analyzer, the real challenge is not learning one exact layout, but developing reliable ways to recognize these structures across many different ECU families.
What is usually stored inside an ECU?
Across engine ECUs, transmission controllers, ABS/ESP modules, airbags, body controllers, and hybrid or EV units, non-volatile memory usually falls into three broad categories.
1. Firmware and boot components
This is the executable side of the ECU. It usually contains a bootloader or flashloader area for startup and reprogramming, plus the main application code that performs the control logic.
2. Calibration data
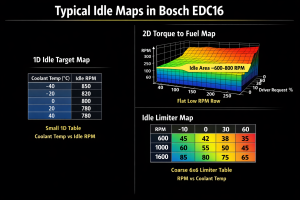
This includes maps, constants, limiters, axes, and conversion values used to tune how the ECU behaves. In dump analysis, these areas are often the most interesting because they contain table-like structures and physically meaningful values.
3. Runtime non-volatile data
This is where the ECU stores learned values, counters, adaptations, coding, DTC-related state, and other persistent information that must survive key cycles and battery disconnects.
Common ECU memory technologies
Depending on the hardware generation and ECU type, data may be stored in several different memory technologies:
- Internal program flash: used for application code, boot sections, and sometimes calibration datasets.
- Internal data flash: often used for EEPROM emulation or structured non-volatile blocks.
- External serial EEPROM: common in clusters, body modules, and other controllers that store small but important data.
- External NOR or NAND flash: used where more storage is needed.
- FRAM: less common, but useful where very high write endurance matters.
| Memory type | Typical role in ECU | What matters in dump analysis |
|---|---|---|
| Internal program flash | Bootloader, application, sometimes calibration area | Look for code regions, sector boundaries, integrity checks, and protected areas |
| Internal data flash | EEPROM emulation, non-volatile runtime data | Often holds structured blocks, counters, DTC-related data, and learned values |
| External EEPROM | Small persistent storage | Often contains odometer, coding, VIN-related data, adaptations, or checksums |
| External NOR flash | Larger firmware or dataset storage | Good candidate for application regions, calibrations, and large binary segments |
| External NAND flash | High-capacity storage in larger systems | May include spare areas, ECC handling, and controller-managed organization |
| FRAM | High-endurance non-volatile storage | Can behave differently from flash because writes are fast and wear behavior is different |
A practical high-level ECU memory layout
Even when offsets are unknown, many ECU dumps can be modeled using a simple high-level structure:
- Boot / flashloader region
- Main application code
- Calibration or dataset region
- NVM region for DTCs, counters, adaptations, and learned values
This model is not universal in exact form, but it is a very useful starting point for analysis. A dump analyzer should try to identify these areas before attempting deeper decoding.
Why endianness matters
Endianness affects almost everything in dump interpretation: scalar values, axis data, pointers, CRC seeds, block IDs, and table dimensions. You cannot safely assume one byte order just because of the CPU family.
A good analyzer should treat endianness as a hypothesis and validate it using self-consistency checks such as:
- Plausible monotonic axes
- Reasonable pointer ranges
- ASCII strings appearing correctly
- Checksums or CRC fields validating only under one byte order
How non-volatile runtime data is often organized
In many ECUs, persistent runtime data behaves like a collection of logical blocks rather than one large unstructured area. These blocks may include administrative headers, sequence counters, redundant copies, checksum fields, or validity markers.
That means a dump analyzer should be able to:
- Recognize repeated block patterns
- Compare multiple copies of the same logical data
- Identify sequence counters or freshness indicators
- Validate candidate CRC or checksum fields
- Select the most recent valid copy when redundancy is used
Important identifiers commonly found in dumps
Even when full decoding is not possible yet, a useful analyzer should try to extract and model common identifiers such as:
- Software version identifiers
- Build or module IDs
- Dataset or calibration IDs
- Configuration IDs
- VIN-like strings where applicable
- DTC-related structures
- Mileage or anti-tamper related values in relevant modules
Heuristics for segmenting an unknown dump
When analyzing an unknown binary, fixed offsets are rarely enough. Cross-ECU heuristics are more valuable.
Look for structural anchors
Large high-entropy regions may indicate compressed, encrypted, or dense code data. Repeated low-entropy patterns may suggest erased flash, table regions, or repeated metadata blocks.
Use repetition as a clue
Repeated structures often point to redundancy, mirrored blocks, duplicated values, or administrative metadata.
Respect flash behavior
Flash memory is erased in units such as pages or sectors. That often leaves visible patterns in dumps, especially around updates, erased areas, and rewritten blocks.
How to find calibration maps without exact definitions
In the tuning and reverse-engineering world, maps are rarely discovered by pure luck. They are usually recognized because their structure looks like axes plus a value matrix.
Useful generic heuristics include:
- Axis candidates: sequences of 8-bit or 16-bit values that rise in a logical way
- Map candidates: rectangular blocks near axis candidates, often with smooth value progression instead of random noise
- Dimension clues: small nearby values whose multiplication matches the size of a candidate map
- Alignment clues: many ECUs align useful data on 2-byte or 4-byte boundaries
In practice, it helps to model a possible map as:
header + axis descriptors + axis arrays + value array + optional integrity field
Example structure patterns an analyzer should recognize
Header + payload + CRC block
A very common pattern in NVM is a small header followed by payload data and then a checksum or CRC field. This may include a block ID, payload length, validity markers, and redundant copies.
2D map with explicit axes
A classic table structure may contain X and Y counts first, then one or two axes, followed by the table values. Signedness, scaling, and endianness all need to be tested rather than assumed.
DTC-like record sets
Diagnostic memory often behaves like a record set containing identifiers, status bytes, counters, and optional extended or freeze-frame style data. Exact OEM layout differs, but the concept appears across many systems.
Checksums, CRCs, and integrity validation
Good dump analysis is not just about locating data. It also requires understanding integrity mechanisms. These often exist at more than one level:
- Update level: package metadata, hashes, or signatures
- Boot level: region verification before execution
- NVM level: per-block checksums or CRCs
An analyzer should keep checksum interpretation flexible. Instead of forcing one answer too early, it should model possibilities such as:
- Additive sums
- Two’s complement sums
- XOR checksums
- CRC8, CRC16, CRC32 families
- Block-based validation scopes
A practical internal model for this is:
start, length, algorithm, stored_at, postprocess
Protected, compressed, and encrypted regions
Not every area of a dump should be decoded aggressively. A reliable analyzer must detect suspicious regions and mark them as opaque where appropriate.
Common warning signs include:
- Very high entropy inconsistent with tables or ordinary metadata
- Structured containers with headers but unreadable payloads
- Regions tied to boot security, option bytes, lock states, or secure storage
- Data that statistically behaves like encrypted or compressed content
Recommended dump analysis workflow
A robust ECU dump analyzer generally follows this sequence:
- Import raw binary or decode HEX / S-record into flat binary form
- Fingerprint the likely hardware and memory layout
- Infer endianness and alignment assumptions
- Segment probable boot, application, calibration, and NVM regions
- Test integrity hypotheses such as CRC and checksum candidates
- Locate structures such as IDs, flags, maps, axes, and DTC-like records
- Detect protected, compressed, or encrypted areas
- Export a structured model with confidence levels
File formats worth supporting
Even if your main focus is raw dumps, it is useful for an analyzer to support the most common transport or container formats used around ECU work:
- Raw binary
- Intel HEX
- Motorola S-record
- ELF-based engineering artifacts when available
It is also useful to recognize that binary data often becomes far more understandable when paired with external definition data such as calibration descriptions, map definitions, or project metadata.
Key risks when working with dumps
Even if the goal is analysis only, users often move from analysis to modification. That creates real technical and safety risks.
- Flash wear and update fragility: rewriting flash is not the same as editing a file on disk.
- Safety-critical consequences: corrupted integrity metadata or wrong parameters can cause faults or non-start conditions.
- Protected data concerns: some regions are intentionally secured and should be treated accordingly.
- Tamper-sensitive areas: mileage and related data often use redundancy and anti-manipulation strategies.
Final takeaway
ECU dump analysis is fundamentally a pattern-recognition problem. The most useful analyzer is not one that knows only a single vendor or a handful of exact addresses, but one that can segment binaries, infer structure, validate integrity, recognize map-like data, and safely identify protected areas across many ECU types.
If you are building your own analyzer, the winning approach is to combine structural heuristics, integrity checking, map detection, and cautious confidence scoring rather than relying on fixed offsets alone.


this is typical for bosch firmwares but simos or delphi are whole other thing mates!
Great , csn you covet delphi dcm 7.1 more please?